
NCERT Solutions for Class 8 Maths Chapter 4 Exercise 4.1 Data Handling - PDF Download

eSaral Academic and Editorial Team
Have you ever seen data in the shape of a circle? In NCERT solutions for class 8 maths chapter 4 ex 4.1 Data Handling introduces pie graph, or circle graph, where the entire circle is divided into different sectors. The size of each sector is proportional to the activity or information it represents. Knowing the correct method to solve NCERT class 8 maths solutions will help students to solve the different kinds of questions that will be asked during the examination.
Class 8 maths chapter 4 exercise 4.1 NCERT solutions is composed of 5 questions where the students have to create pie charts based on the data set. These solutions are prepared by eSaral’s maths experts with the proper reference and explained step by step. To practice questions of ex 4.1, you can download the PDF format of NCERT solutions. These solutions can be downloaded free of cost from the eSaral website.
Topics Covered in Exercise 4.1 Class 8 Mathematics Questions
NCERT solutions class 8 maths chapter 4 ex 4.1 data handling focuses on the topic of circle graph or pie chart. eSaral provides a detailed explanation of this topic which you can check below.
|
1. |
Important Point to Remember |
|
|
2. |
Circle Graph or Pie Chart |
|
- Important Point to Remember
Data - Data is any piece of information that has been collected in a number, word, measure, symbol, or any other way.
Type of Graph
- Pictograph - When the data is represented by pictures or symbols, it is referred to as a Pictograph.
- Bar Graph - In a bar graph, all the data is represented by equal width bars with equal gaps, but the bar height represents the respective values.
- Double Bar Graph - The double bar graph is used to compare some data because it shows the data of two quantities at the same time.
2. Circle Graph or Pie Chart
If the data is represented in the form of a circle, then it is referred to as a pie chart. This graph illustrates the relationship between a whole and its parts. The circle must be divided into sectors. Each sector is related to its activity. It is used when we have information about a percentage or fraction.
- Drawing pie charts
If the data is expressed as a percentage, then the corresponding angles need to be determined in order to show them on the pie chart. Since it is known that a full circle is composed of 360 degrees, the fraction of 360° must be calculated for each sector.
Tips for Solving Exercise 4.1 Class 8 Chapter 4 Data Handling
The NCERT solutions class 8 maths chapter 4 ex 4.1 Data Handling contains numerous questions that will assist students in comprehending the concepts of pie charts accurately. You can go through the tips provided by eSaral to solve the questions easily.
- Students need to go through all the concepts in chapter 4 ex 4.1 and practice the questions on their own.
- Students must learn how to calculate data in a pie chart that will give them a clear understanding of how to sort the data into the various sectors of the circle.
- Revising the concepts will also strengthen the key concept of ex 4.1. So, students can solve the questions properly.
Importance of Solving Ex 4.1 Class 8 Maths Chapter 4 Data Handling
By practising NCERT solutions class 8 maths chapter 4 ex 4.1, students will be able to solve the questions and understand the concepts. Below are a few benefits of solving questions for class 8 maths chapter 4 ex 4.1.
- Our NCERT solutions class 8 maths chapter 4 ex 4.1 questions are based on pie chart topics. Students should re-evaluate and clear all doubts before solving the questions.
- All the solutions are available in pdf format on eSaral. These solutions are easy to download and easy to save for further use too.
- All the answers are provided by experts of eSaral. These solutions are accurate and have proper explanations.
- NCERT solutions offered by eSaral are designed to make even the most difficult topics accessible to all students so that every student can use it.
Frequently Asked Questions
Question 1. What is a Pie Chart?
Answer 1. A pie chart is a graphical representation in which numbers, percentage, and degree values are represented using a circle graph. The circle is used to represent the entire data, while the sector is used to represent the values that are part of the data.
Question 2. What are pie charts used for?
Answer 2. There are many uses for pie charts.
- It is used to represent different types of data.
- It is used to represent data of various demographics.
- It is used to represent various objects of sales, marketing etc.
Team eSaral
eSaral Academic and Editorial Team
Team eSaral is the collective author profile for educational content created by eSaral’s teachers and academic contributors. The team draws on expertise from IIT graduates, doctors, experienced educators and subject specialists to develop resources for JEE, NEET and school students. Our articles aim to explain concepts clearly and help students study with confidence.
Related Posts

BITSAT 2027: Registration Date, Exam Date, Syllabus, Eligibility, Pattern & Fees
BITSAT 2027 exam dates, registration timeline, eligibility criteria, exam pattern, marking scheme, syllabus and fees in one page.
BITSAT Previous Year Question Paper PDF (2017-2026)
Download BITSAT previous year question papers PDF from 2017 to 2026,session-wise. Memory-based papers,exam pattern, paper analysis and how to practise
CBSE Class 10 Date Sheet 2027: Expected Exam Dates, Release Date, Admit Card & Result Timeline
CBSE Class 10 date sheet 2027 is awaited. See the expected exam dates, release window, how to download the PDF, admit card and result timelines.
NCERT Physics Class 10 Book PDF in Hindi 2026-27 – भौतिक विज्ञान के 4 अध्याय (Free Download)
NCERT Physics Class 10 book PDF in Hindi 2026-27: download all 4 chapters (अध्याय 9–12) free, with topics and important formulas.
NCERT Biology Class 9 Book Anveshan PDF in Hindi - जीव विज्ञान कक्षा 9 पुस्तक अन्वेषण PDF
Download NCERT Biology Class 9 book PDF in Hindi chapterwise for 2026-27: Cell, Tissues, Reproduction and Diversity. Free PDFs.
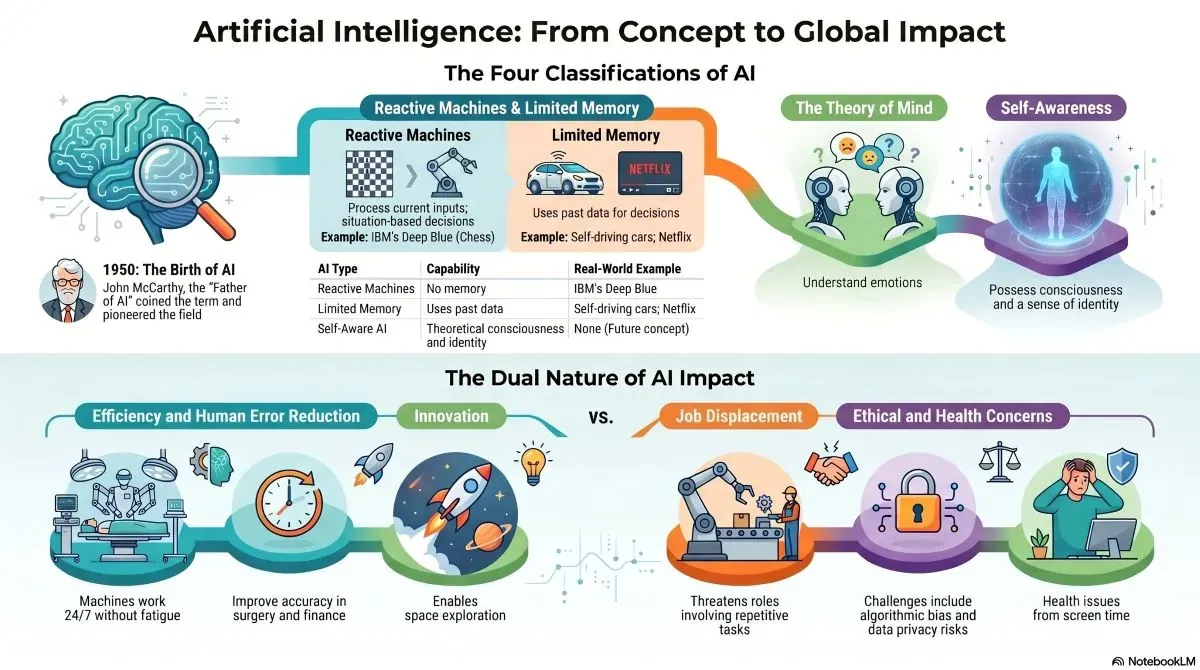
Essay On Artificial Intelligence in English (100,150, 200, 250, 300, 500 Words)
This is in contrast to the natural intelligence of humans. With Artificial Intelligence, machines can perform

Essay on 78th India Independence Day in English for Student (100, 150, 200, 250, 300, 500 Words)
Read the best essays on India's Independence Day in English. Short & long essays (100, 150, 200, 250, 300, 500 words) perfect for school exams
NCERT Class 11 English Snapshots book - Free PDF download- Esaral
Download NCERT Class 11 English Snapshots book PDF for free. Get all 8 chapters, chapter-wise. Start your prep today!
NCERT Class 10 biology book pdf - Free PDF Download - eSaral
NCERT Class 10 Biology book PDF 2026-27: all 5 chapters (Life Processes to Our Environment) in English & Hindi, with CBSE syllabus, marks & practical

Essay on Global Warming in English (100,150, 200, 250, 300, 500 Words)
Global warming means the Earth is getting hotter. This happens because of things like pollution from cars and factories.