
NCERT Solutions for Class 9 Maths Chapter 12 Exercise 12.1 Statistics - PDF Download

eSaral Academic and Editorial Team
The NCERT solutions for class 9 maths chapter 12 ex 12.1 focuses on graphical representations, which emphasize the various methods of showing the data, such as bar graph, histogram, frequency polygons, etc. Bar graphs are two-dimensional representations of numerical data in which each data point in a dataset is represented by a vertical bar extending from one edge to the other.
Class 9 maths chapter 12 exercise 12.1 NCERT solution for Statistics consists of 9 questions in which some of the questions are asked to present the data in a bar graph, some of them about histogram and some of questions are about frequency polygon. Our subject experts of maths have provided step-by-step answers to all the questions given in NCERT solutions. All the essential concepts associated with the questions have been explained in these solutions. These solutions are the best practice for preparing for CBSE examinations. The best way to strengthen your knowledge is to use NCERT Solutions provided by eSaral. Students should go through these solutions to identify their weak points. You can also download the NCERT class 9 exercise 12.1 in PDF format from the official website of eSaral. It is free to download, so students can use it.
Topics Covered in Exercise 12.1 Class 9 Mathematics Questions
Chapter 12 of class 9 maths ex 12.1 focuses on fundamental concepts such as Histogram, Bar graph and frequency polygon over graphs, as outlined in terms such as frequency, maximum and minimum values, which are related to each of the questions of the exercise.
|
1. |
Graphical Representation of Data |
|
- Graphical Representation of Data
It is widely accepted that a graphical representation of data is more effective than a thousand words. There are various techniques that can be used to present data in a visually appealing manner.
(A) Bar Graphs - Bar graph is a graphical representation of a variable in which bars of the same width are drawn with the equal spacing.
The value of the variable is shown on the other axis and the bar height represents the value of the variable. This is the simplest way to represent the data as rectangular bars.
- Each bar should be of the same thickness.
- The distance between bars should be the same.
- The bar height should correspond to the numerical value to be represented.
(B) Histogram - It is like a bar graph, but it is used to represent continuous class intervals.
- You need to draw the class intervals on the x-axis.
- The height represents the frequency of the class intervals.
(C) Frequency Polygon - Frequency is another term for describing quantitative data.
To representing data in frequency polygon
- The first step is to draw a histogram.
- Then join the mid-points of the upper sides of the adjacent rectangles of this histogram by means of line segments.
- The middle of the first bar should be connected to the middle of the imaginary interval on the x-axis.
- The middle of the last bar should be connected to the middle of the next interval of the x-axis.
If you want to draw a frequency polygon without using the histogram, you will need to figure out the class mark of each interval first and then use those points to make the frequency a polygon.
To find the class-mark of a class interval, we find the sum of the upper limit and lower limit of a class and divide it by 2.
Class-mark = upper limit + lower limit/ 2
Tips for Solving Exercise 12.1 Class 9 Chapter 12 Statistics
eSaral’s academic team of mathematics have combined some very useful tips to solve graph questions included in ex 12.1. You can check them below.
- You can easily solve the questions in NCERT solutions class 9 maths chapter 12 ex 12.1 Statistics if you practice with different types of graphs using the examples given.
- In order to understand the distinctions between the bar graph, the histogram, and the frequency polygon, students should practice the graph described in the NCERT solutions provided by eSaral’s subject experts.
Importance of Solving Ex 12.1 Class 9 Maths Chapter 12 Statistics
Solving questions of NCERT solutions for class 9 maths chapter 12 ex12.1 provided by subject experts of eSaral have tremendous benefits and they are very reliable.
- NCERT solutions for class 9 maths ex 12.1 are created by eSaral, with the aim of helping students and covering all questions including Statistics.
- All solutions are presented in a comprehensive and sequential manner, allowing students to solve all questions with ease.
- These solutions are highly precise and detailed, which can assist students in preparing for the examination.
- NCERT solutions for ex 12.1 class 9 maths are available in PDF format which you can download for future reference.
Frequently Asked Questions
Question 1. What do you understand by the Bar graph?
Answer 1. Bar graph is a graphical representation of a variable in which bars of the same width are drawn with the equal spacing. Bar graphs are a way of comparing and contrasting different types of data by simply comparing quantities, frequencies, or other measurements.
Question 2. Define Histogram according to NCERT solutions class 9 maths chapter 12 ex 12.1?
Answer 2. It is like a bar graph, but it is used to represent continuous class intervals.
Question 3. What do you mean by frequency Polygon?
Answer 3. frequency polygon is a graphic representation of a distribution. Market views are used to understand the form of a distribution.
Team eSaral
eSaral Academic and Editorial Team
Team eSaral is the collective author profile for educational content created by eSaral’s teachers and academic contributors. The team draws on expertise from IIT graduates, doctors, experienced educators and subject specialists to develop resources for JEE, NEET and school students. Our articles aim to explain concepts clearly and help students study with confidence.
Related Posts
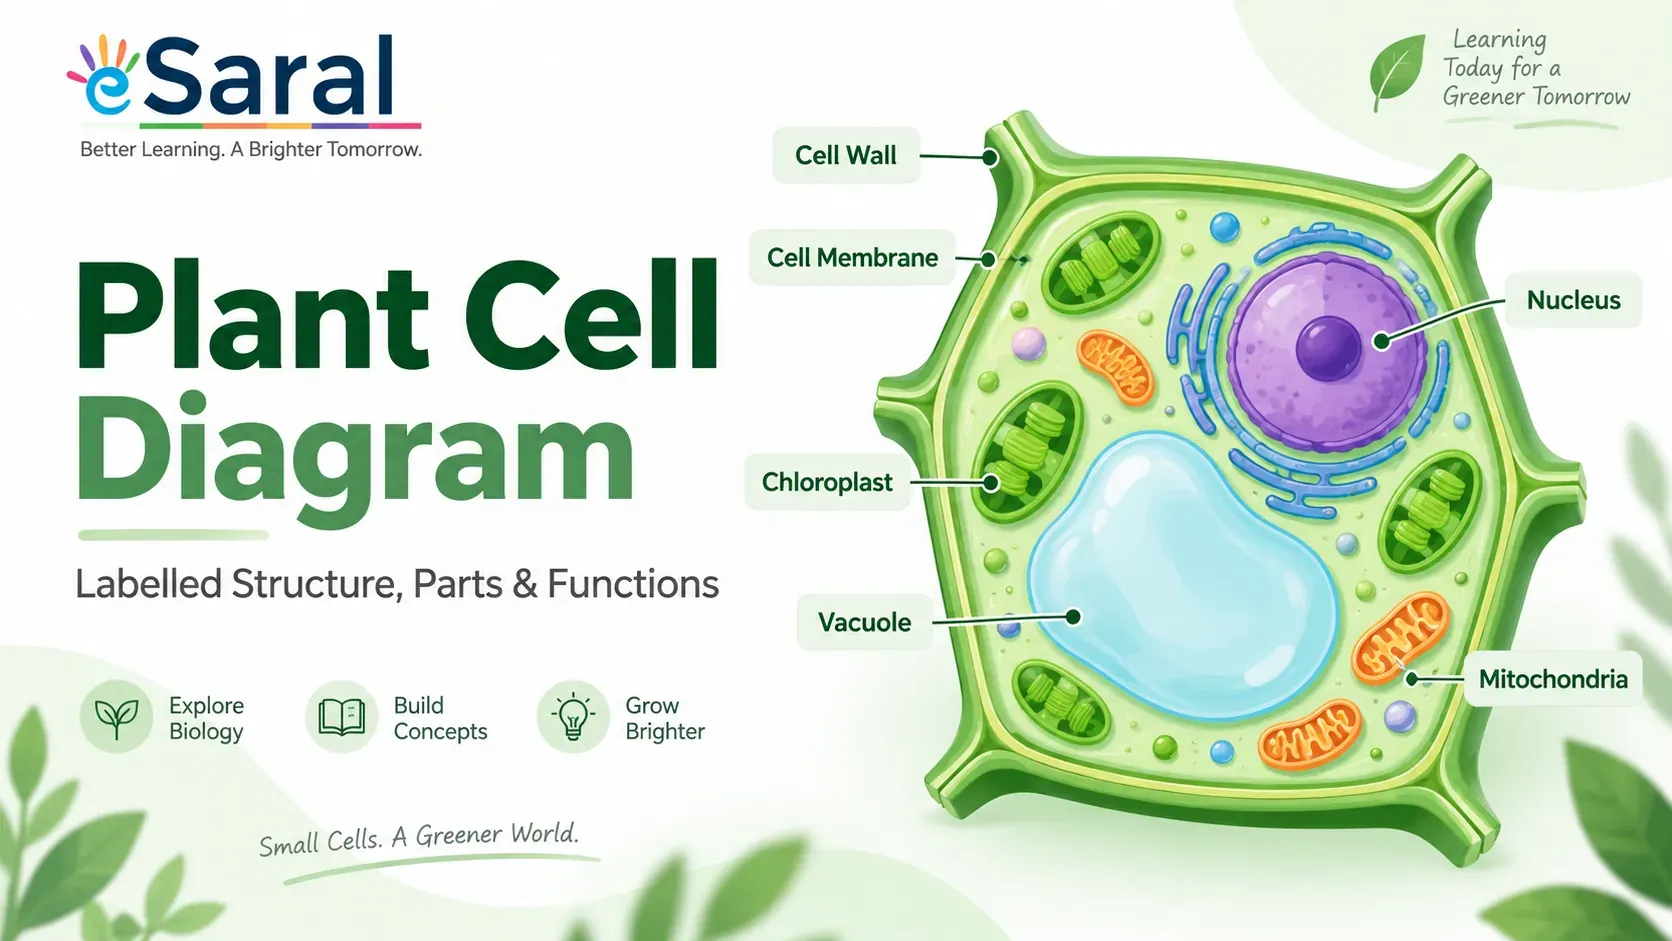
Plant Cell Diagram: Labelled Structure, Parts and Functions
Simple, labelled plant cell diagram with parts and functions. Covers plant cell structure for Class 6, 7, 8, 9, 10 and 11 students, CBSE-aligned.
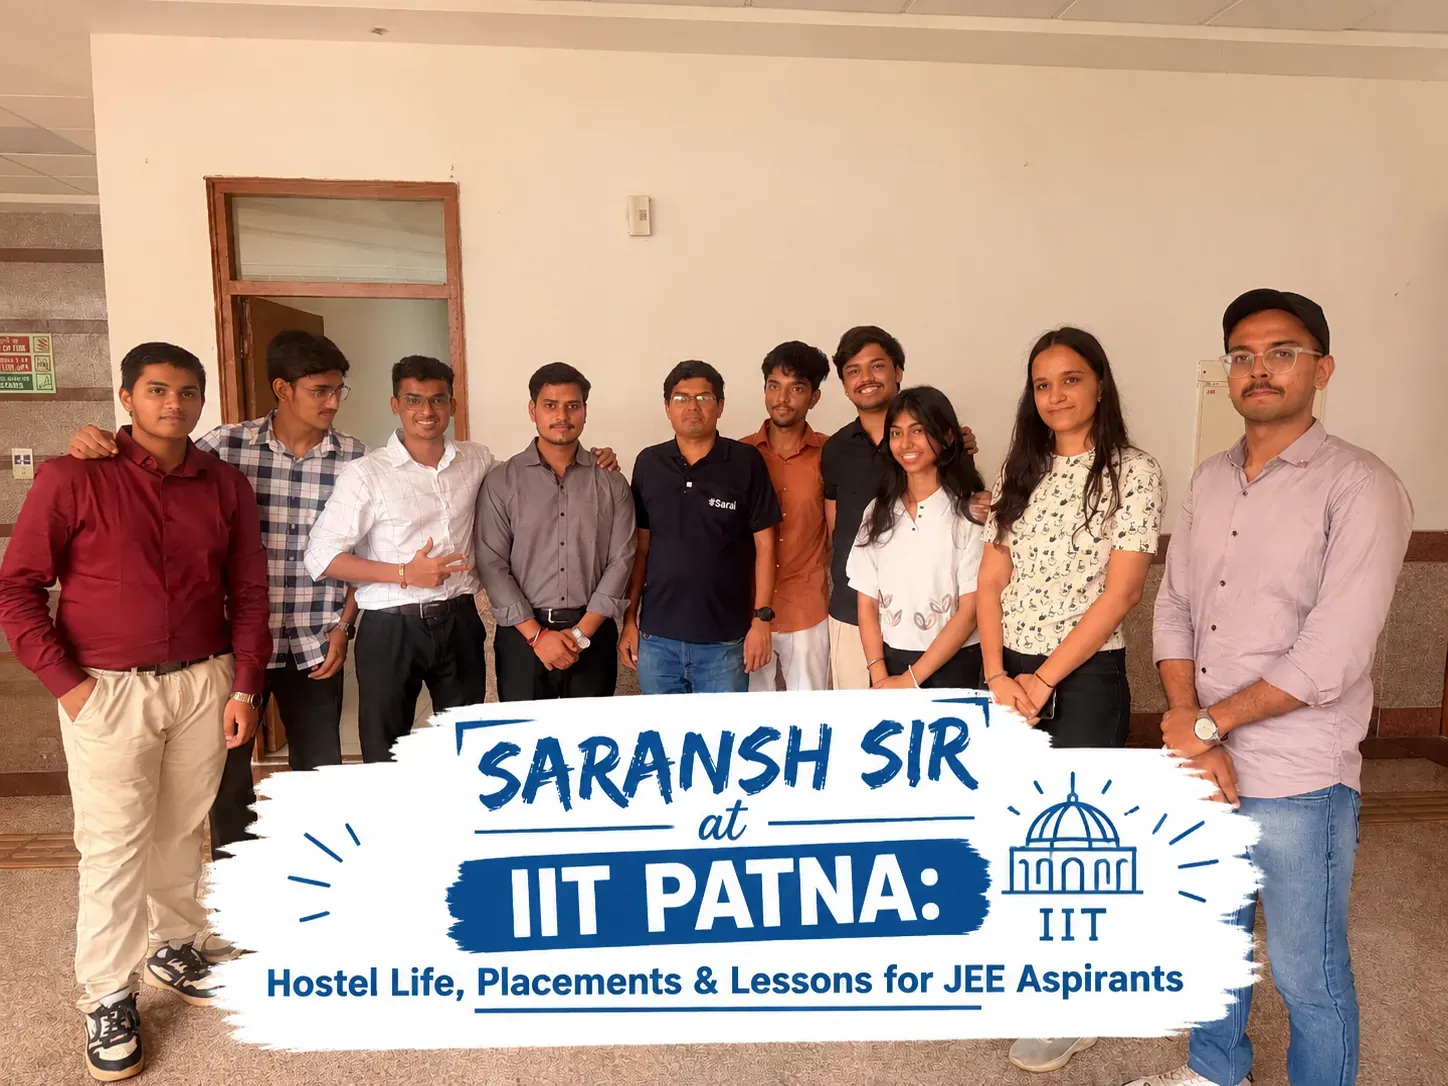
Saransh Gupta Sir's Visit to IIT Patna: Hostel Life, Placements & Lessons for JEE Aspirants
Inside Saransh Gupta Sir's IIT Patna visit — hostel life, the library, placements, internships, and real advice for JEE aspirants from students living the IIT dream.
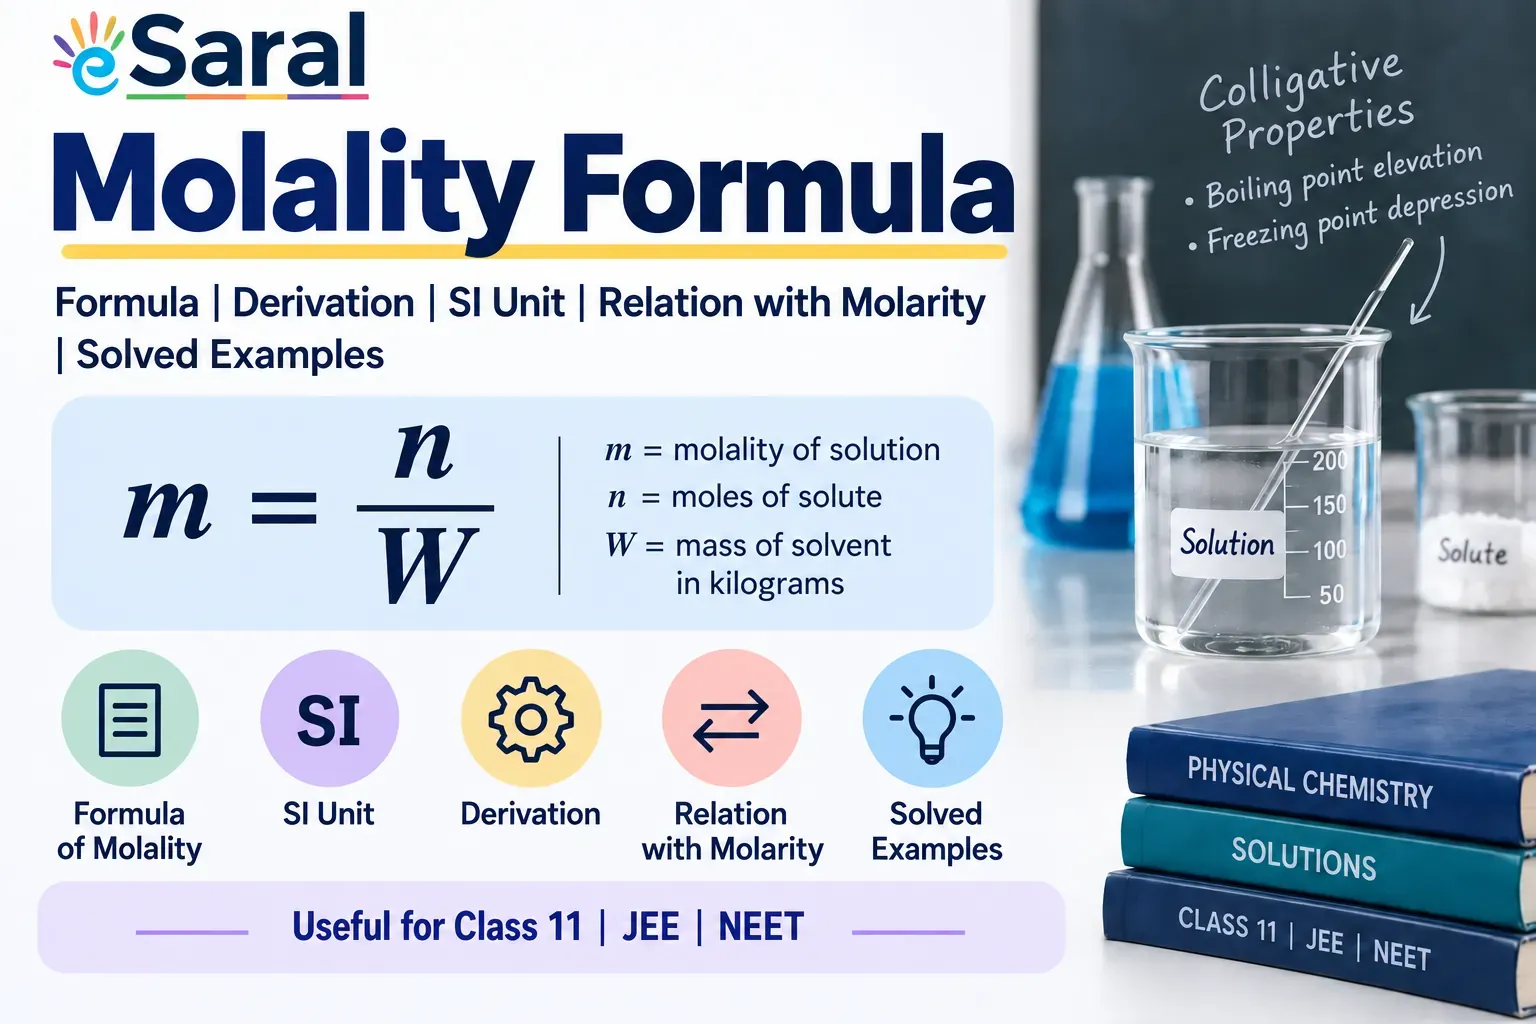
Molality Formula: Formula for Molality, Derivation & Solved Examples
Molality formula is $m = \dfrac{n}{W}$. Learn the formula of molality, its SI unit, derivation, relation with molarity, and solved examples for Class 11, JEE and NEET.
BITSAT Previous Year Question Paper PDF
Download BITSAT previous year question papers PDF. Get year-wise BITSAT PYQs, memory-based papers, exam pattern, and preparation tips to improve your BITSAT preparation.

Teachers’ Day 2026 at eSaral Gurukul: Celebrating the Bond Between Students, Teachers & Mentors
See how Teachers’ Day 2026 was celebrated at eSaral Gurukul, reflecting the bond among students, teachers, and mentors, and the role of guidance beyond academics.
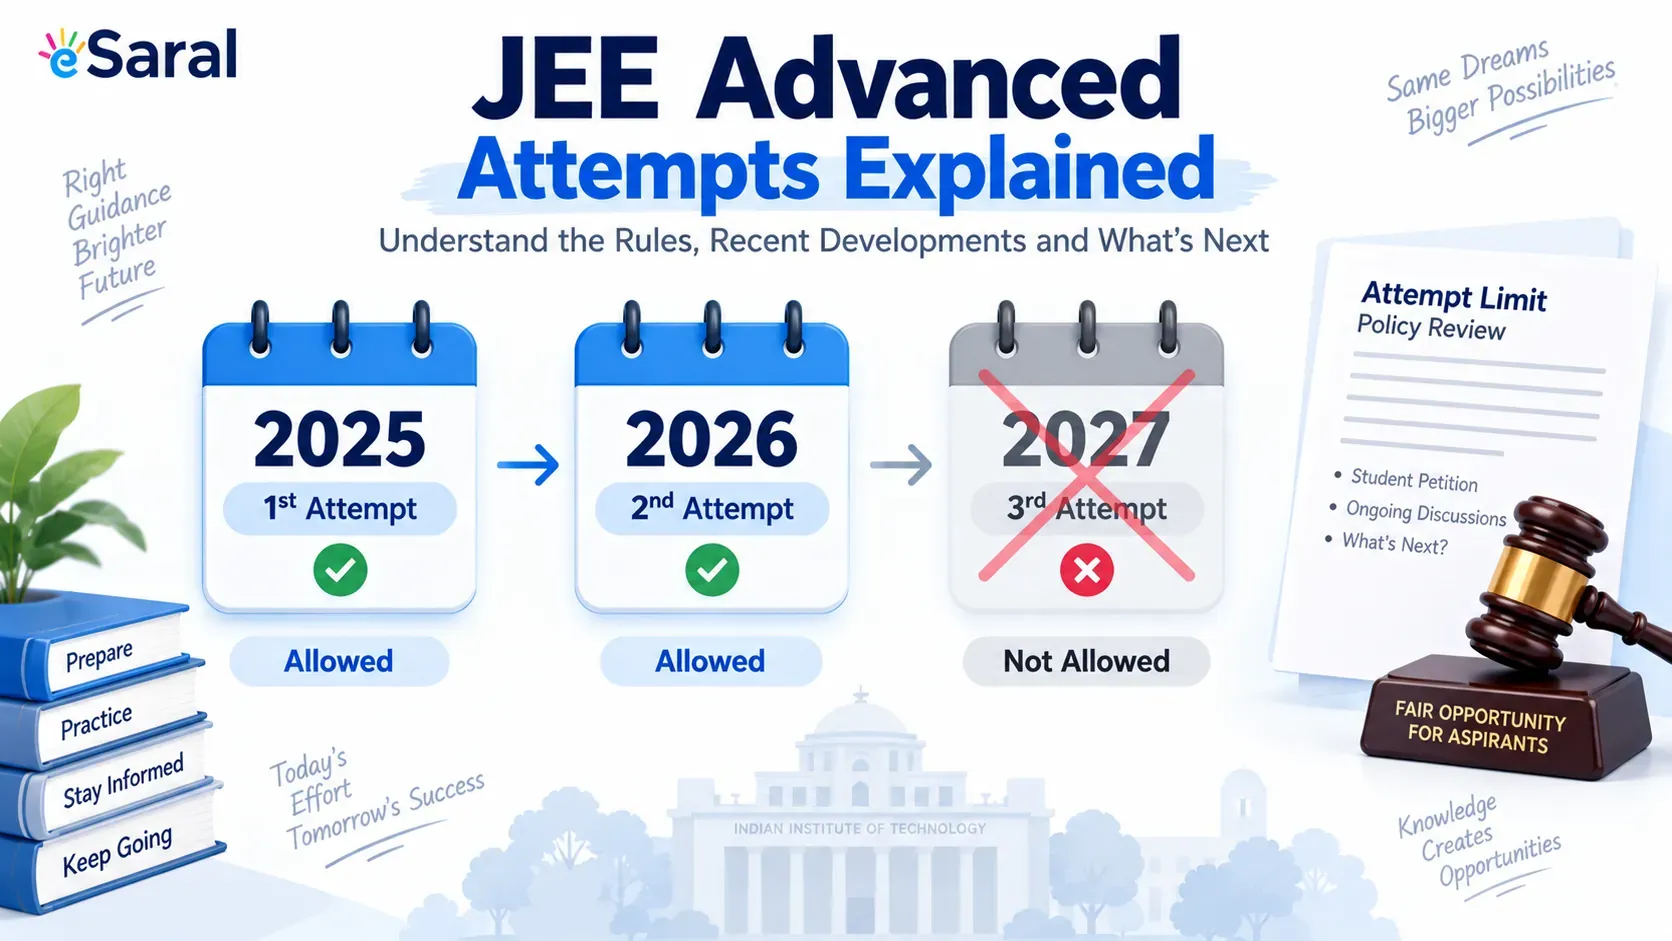
JEE Advanced Attempts: Can You Give It a Third Time? Rules Explained
JEE Advanced attempts: current rule is 2 consecutive years only: full eligibility criteria, the 2025 third-attempt controversy, and the latest 2026 petition news.

Best JEE Preparation App
Best JEE preparation app for Main & Advanced: AI mock tests, live doubt-solving, thousands of practice questions. JEE preparation app for droppers & Class 11-12.
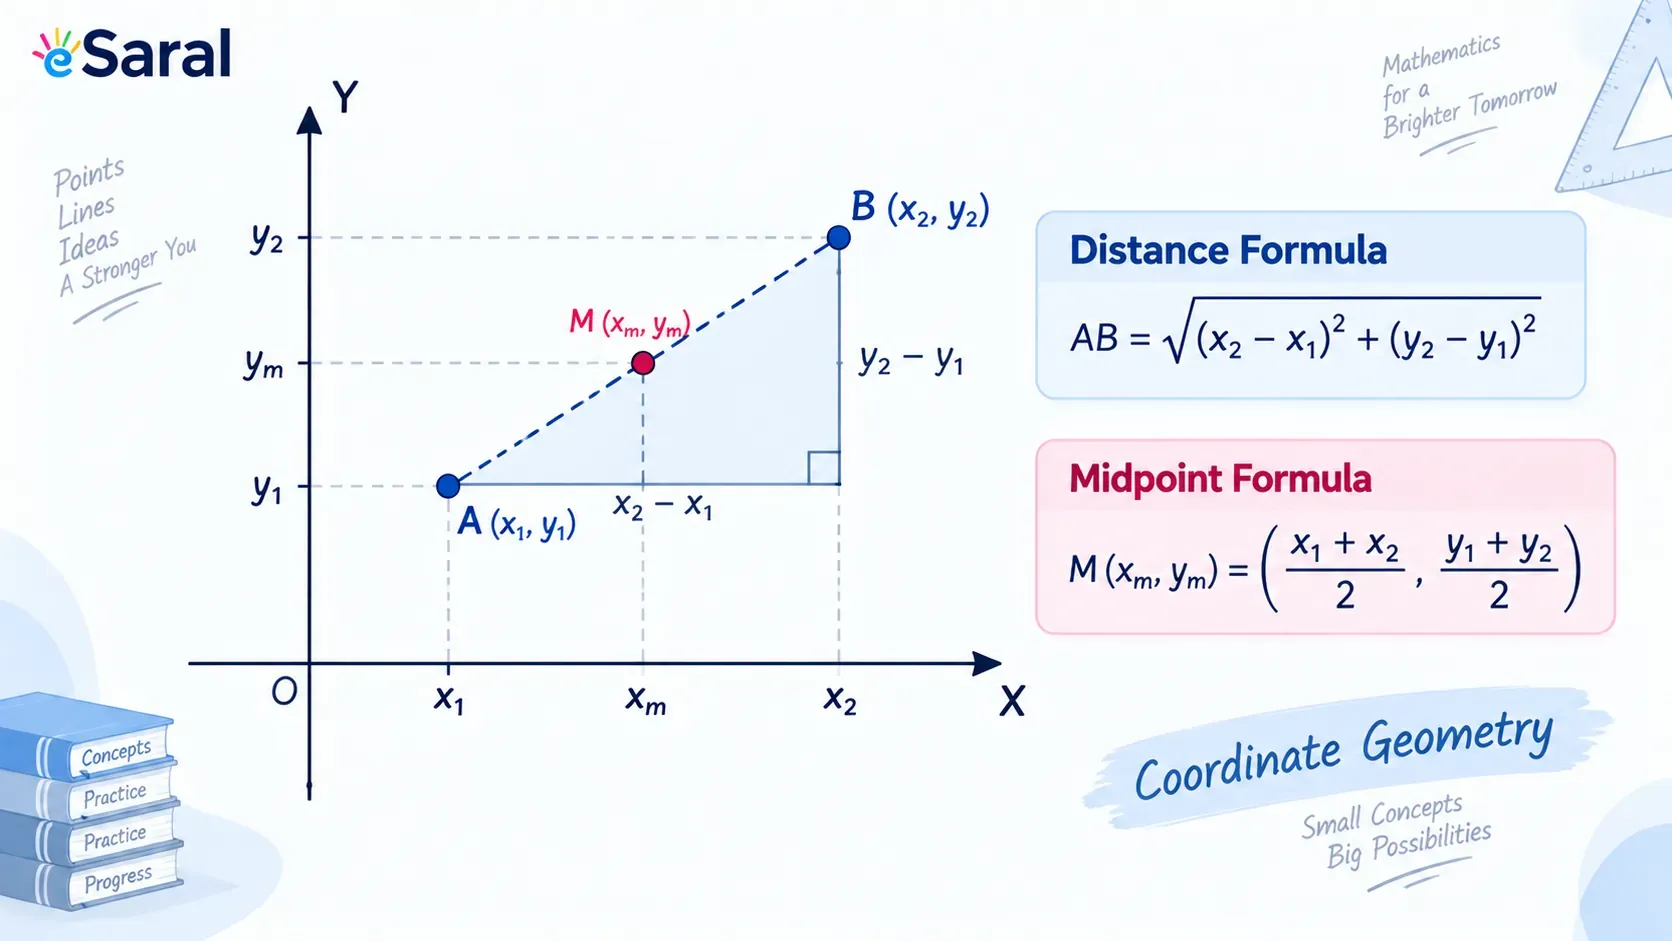
Coordinate Geometry Class 10: Formulas, Notes & Solved Examples
Coordinate geometry class 10: complete CBSE formulas — distance, section, midpoint and area of triangle — with derivation, notes and solved examples.
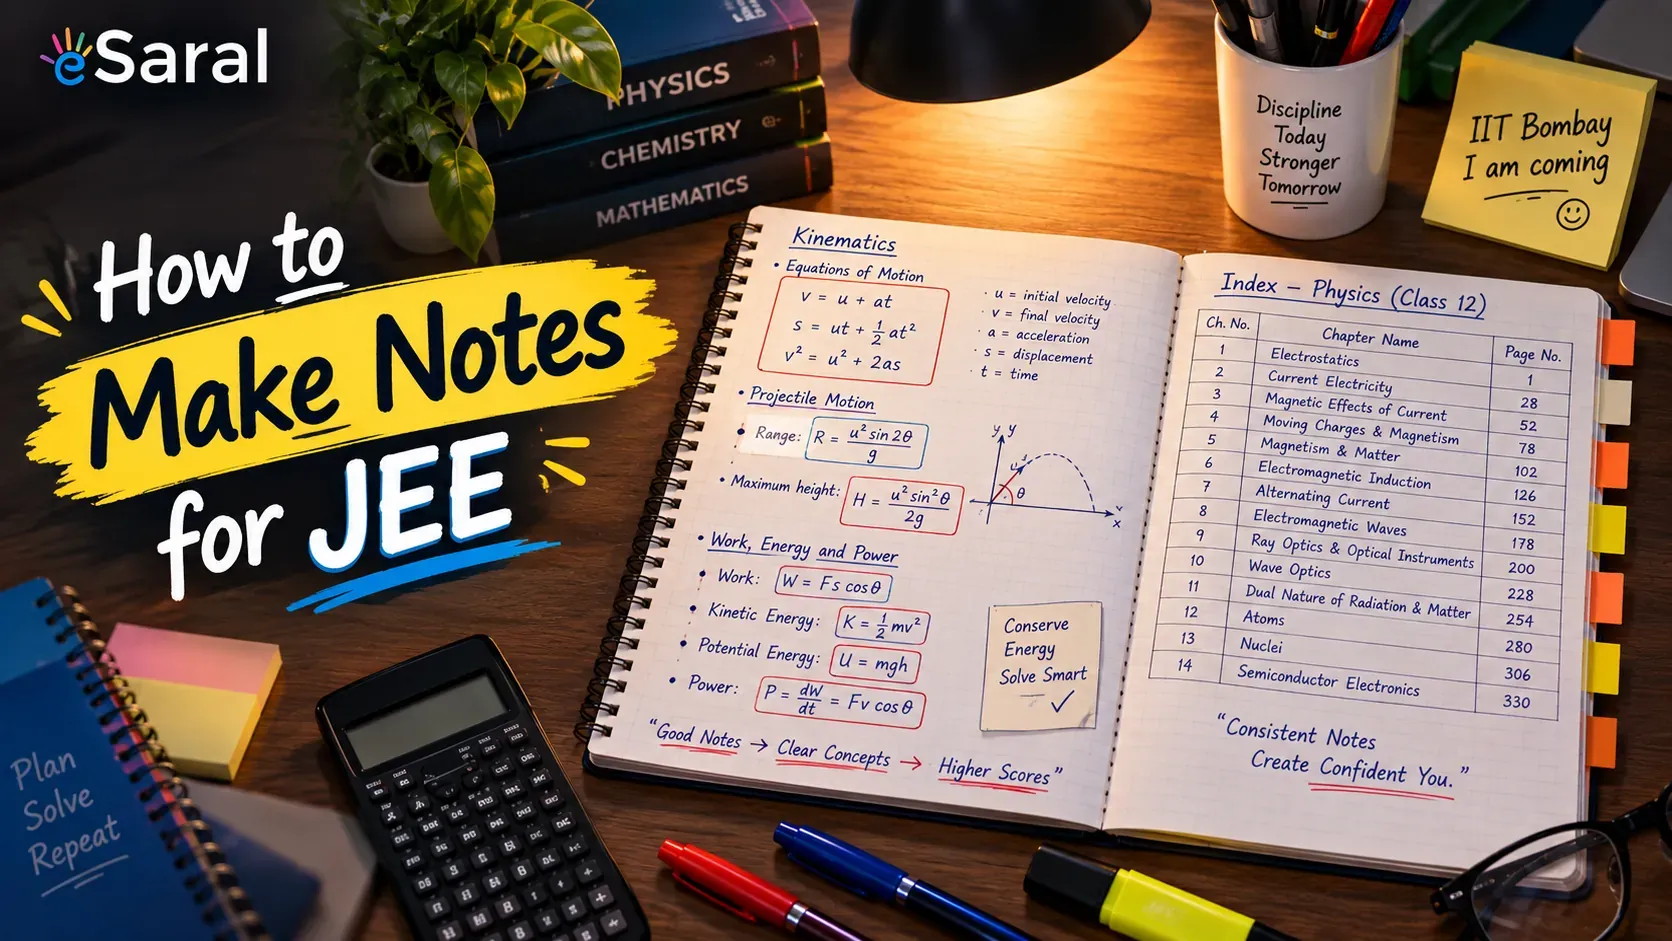
How to make Notes For JEE Smart Notes Strategy of an AIR 41
Learn how to make notes for JEE the way toppers do — indexing, shorthand, and smart short notes for JEE that cut revision time to just 5–7 days.
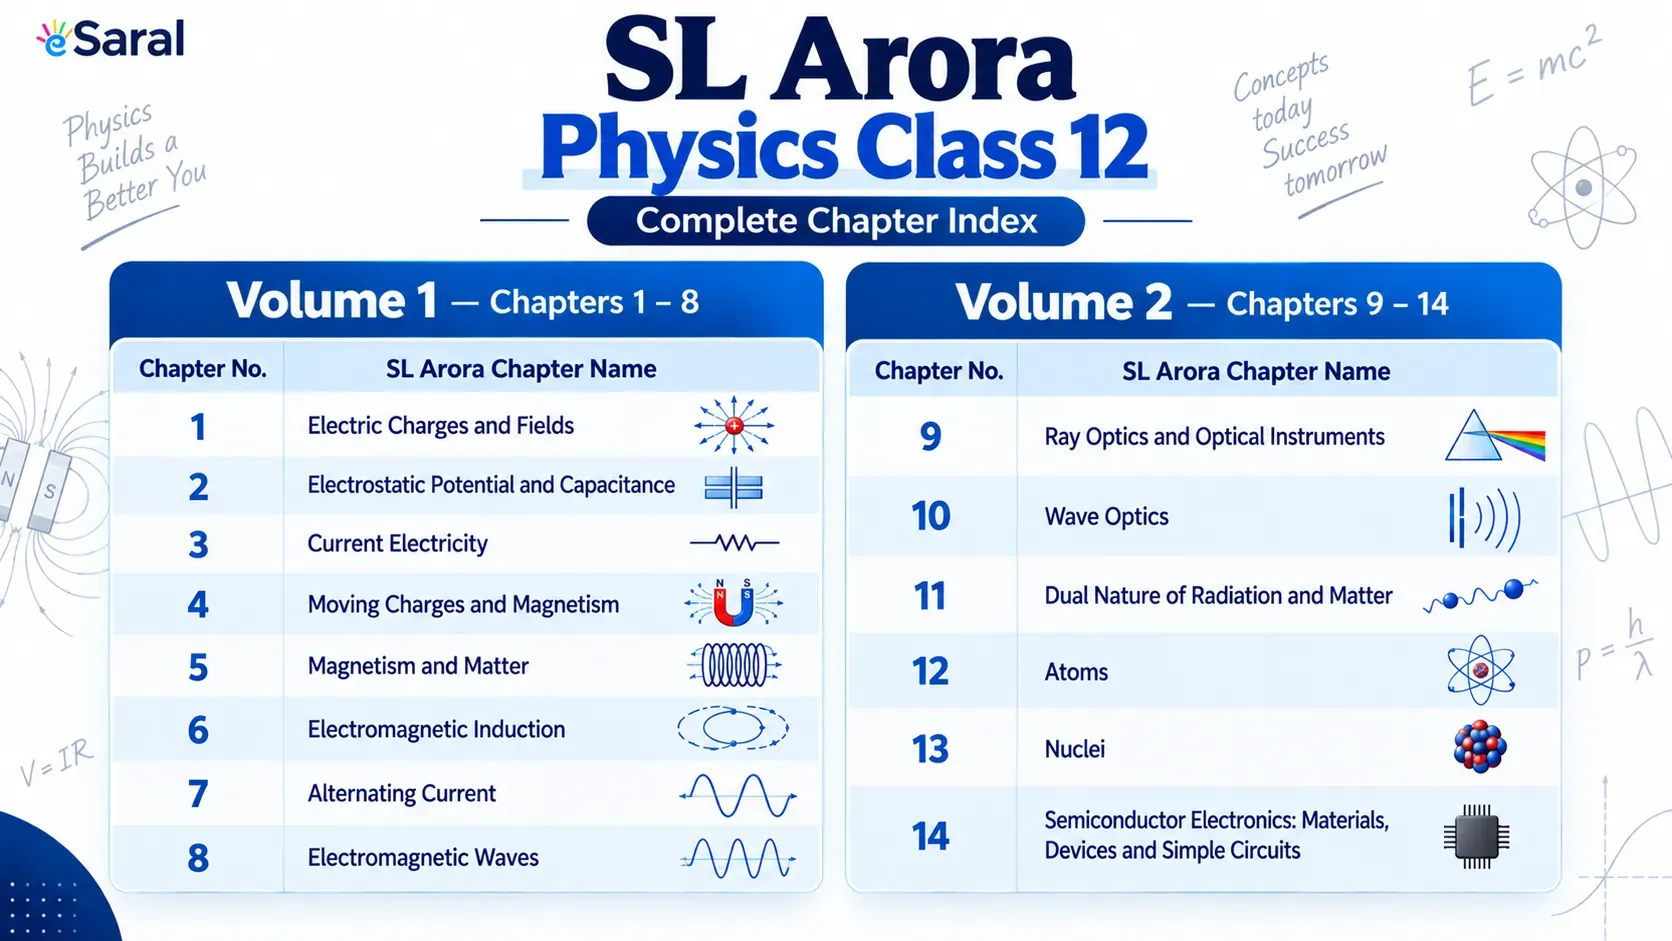
SL Arora Physics Class 12 Index – Chapter List for Volume 1 & 2
SL Arora Physics Class 12 index — complete chapter list for Volume 1 & 2, mapped to NCERT solutions for board, JEE Main, and NEET preparation.