
JEE Mains Percentile to Rank 2026

eSaral Academic and Editorial Team
What JEE Main Percentile Actually Means
If you got your JEE Main result and saw a percentile number, you need to understand exactly what it represents. Most students get this wrong.
Your percentile is NOT your marks percentage. It's your relative standing among all students who wrote the same exam session as you.
Think about it this way: if 10 lakh students appeared in your session and you scored better than 9,90,000 of them, your percentile is 99.0. Only 10,000 students beat you. That's it.
The Three Components of Your JEE Main Percentile
NTA doesn't just give you one percentile — they calculate three separate scores:
Component | What It Measures |
|---|---|
Physics Percentile | Your relative performance in Physics only |
Chemistry Percentile | Your relative performance in Chemistry only |
Mathematics Percentile | Your relative performance in Mathematics only |
Overall Percentile | Your combined performance across all three subjects (this decides your rank) |
The overall percentile is what matters for college admissions. Your rank comes from this number alone.
How NTA Calculates Your Exact Percentile
The formula is deceptively simple:
Percentile = (Number of students scoring ≤ your score ÷ Total students in your session) × 100
Example: Out of 10,000 students in your session, 9,996 scored equal to or below you.
- Your percentile = (9,996 ÷ 10,000) × 100 = 99.96 percentile
But here's what makes this system brilliant: NTA calculates these numbers to 7 decimal places — that's precision like 99.9876543. Why? Because at the elite level, even a 0.01 difference in percentile can change your rank by hundreds of positions.
💡 Expert Tip by Saransh Gupta, IIT Bombay AIR-41: "Don't obsess over the exact percentile number. What matters is whether you're at 99.9, 99.5, or 99.0. Those brackets decide your college destiny. The 7-decimal precision is for breaking ties among thousands of students, not for your mental peace. Focus on your preparation, not the decimal places."
How JEE Main Rank is Calculated
Now that you understand percentile, let's talk about rank — the number that actually decides which college seat you get.
Your rank is your position among ALL JEE Main candidates across every single session — January, April, all shifts, all days combined.
The Direct Relationship: Percentile → Rank
Higher percentile = Better rank. It's that simple.
But here's the critical insight: rank distribution is NOT linear. This is the biggest mistake students make when trying to estimate their rank.
Two Types of Ranks in JEE Main
JEE 2019 onwards (when NTA took over), there are two main rank lists:
Common Rank List (CRL): Your overall position among all candidates, regardless of category. This is your primary rank.
Category Rank: Your position within your specific category (if applicable — OBC-NCL, SC, ST). Some reserved seats use this ranking.
The Tier System: Why 0.1 Percentile = Hundreds of Ranks
Let me show you why small percentile differences are actually massive rank differences:
At 99.9 percentile: You're competing with approximately 500 candidates for the top ranks. A 0.01 difference pushes you 50+ positions.
At 99 percentile: You're with approximately 8,500 candidates. The same 0.01 percentile difference moves you 85+ positions.
At 95 percentile: You're with approximately 50,000 candidates. A 0.1 percentile difference means 500 rank positions.
The higher you go, the tighter the competition. The lower you go, the bigger the rank jumps per percentile point.
Why Raw Marks Don't Matter Anymore
Before 2019, JEE Main had one paper, one day, one set of difficulty. Then everything changed.
The Problem: Different Papers, Different Difficulties
JEE Main 2025 had multiple sessions:
- January Session 1, 2, 3, 4
- April Session 1, 2, 3, 4
- Each session had morning and evening shifts
- Each shift got a completely different question paper
Some papers were objectively tougher. Some were easier. If we used raw marks to rank students:
- Student in easy session with 280 marks = Rank 50
- Student in tough session with 280 marks = Rank 500
This is unfair. Both scored the same marks but faced different difficulties. The tough-session student got punished for bad luck.
How Percentile Solves This Problem
The percentile system flips the logic:
Same Session, Different Raw Marks = Different Percentiles
- Easy session: 280 marks = 99.97 percentile
- Tough session: 220 marks = 99.95 percentile
Both students get similar percentiles because both dominated their respective sessions relative to other students facing the same paper difficulty.
💡 Expert Tip by NK Gupta, IIT Bombay Faculty: "This is why we always tell students: don't compare your marks with friends from other shifts. Marks are meaningless. Percentile is everything. A 180 in a tough shift can be better than a 200 in an easy shift. The system is designed to be fair — trust it."
Real 2025 Data Proving This
Session | Paper Difficulty | Topper Marks | Topper Percentile |
|---|---|---|---|
Jan 22 Morning | Tough | 270 | 100 |
Jan 22 Evening | Easy | 295 | 100 |
April 2 Morning | Medium | 280 | 100 |
April 2 Evening | Very Tough | 250 | 100 |
Both toppers in each session got 100 percentile, even though their marks varied from 250 to 295. Fair game. No luck involved.
JEE Main 2025 Marks vs Percentile Data
These aren't predictions or estimates. This is exactly what happened when 8.5 lakh students fought for their engineering dreams in 2025.
The Elite Tier: 270+ Marks Territory
At the absolute top, every mark counts exponentially.
Marks Range | Percentile Range | Rank Range | What It Means |
|---|---|---|---|
290-300 | 99.999-100 | 1-20 | IIT Bombay/Delhi CSE (only 24 students hit 100 percentile in Paper 1) |
280-289 | 99.998-99.999 | 21-100 | IIT Bombay/Delhi/Madras core branches |
270-279 | 99.996-99.998 | 101-200 | IIT Madras/BHU/Kanpur CSE |
Key insight: Just 10 marks separate you by 100+ ranks at this level. One careless mistake in Maths = 50 rank positions lost.
The Serious Contender Zone: 150-270 Marks
This is where most strong JEE aspirants land and where NIT seats are decided.
Marks Range | Percentile | Rank Range | Typical Colleges |
|---|---|---|---|
200-219 | 99.740-99.869 | 1,501-3,000 | Top NITs: Trichy, Warangal, Surathkal |
180-199 | 99.560-99.739 | 3,001-5,000 | Good NITs: Calicut, Rourkee, Allahabad |
150-179 | 99.000-99.559 | 5,001-10,000 | Tier 2 NITs + IIITs + GFTIs |
The sweet spot? Around 150 marks typically fetched 97+ percentile, opening doors to top-tier colleges.
The Reality Check Zone: Below 150 Marks
Even if you didn't score as expected, let's look at your options:
Marks Range | Percentile | Typical Path |
|---|---|---|
120-149 | 94-97 | JEE Advanced attempt (marginal) |
90-119 | 87-94 | Decent GFTI colleges, state colleges |
60-89 | 75-87 | State engineering colleges, semi-government |
30-59 | 50-75 | Not recommended for pure engineering; consider diploma or other streams |
JEE Advanced Qualification Cutoffs 2025
Many students ask: "Can I qualify for JEE Advanced with my percentile?"
NTA set these minimum percentiles in 2025:
Category | Minimum Percentile | Approximate Marks (Easy Session) |
|---|---|---|
General | 93.10 | 80-85 |
OBC-NCL | 79.43 | 50-55 |
SC | 61.15 | 30-35 |
ST | 47.90 | 15-20 |
These cutoffs shift yearly based on exam difficulty and candidate distribution.
Percentile to Rank Conversion Formula
Here's the mathematical foundation of the entire system:
The Simple Formula
Rank = (100 - Percentile) × (Total Candidates ÷ 100)
Let's apply this with real 2025 numbers. Total JEE Main 2025 candidates = 8.5 lakh (8,50,000)
Real-World Calculations
Your Percentile | Calculation | Your Rank |
|---|---|---|
99.5 | (100-99.5) × (850,000÷100) = 0.5 × 8,500 | 4,250 |
99.0 | (100-99.0) × (850,000÷100) = 1.0 × 8,500 | 8,500 |
98.5 | (100-98.5) × (850,000÷100) = 1.5 × 8,500 | 12,750 |
98.0 | (100-98.0) × (850,000÷100) = 2.0 × 8,500 | 17,000 |
95.0 | (100-95.0) × (850,000÷100) = 5.0 × 8,500 | 42,500 |
90.0 | (100-90.0) × (850,000÷100) = 10 × 8,500 | 85,000 |
Why This Non-Linear Distribution Matters
Notice how ranks spread differently at different percentile levels:
- Moving from 99.5 to 99.0 (0.5 point drop) = 4,250 rank loss
- Moving from 98.0 to 97.5 (0.5 point drop) = 4,250 rank loss
- Moving from 95.0 to 94.5 (0.5 point drop) = 4,250 rank loss
Wait — these are all the same. The formula is actually linear. But here's what feels non-linear: the difficulty of achieving each percentile tier.
Improving from 94 to 95 percentile requires 200+ extra marks in most papers. Improving from 99.8 to 99.9 percentile might only require 5-10 extra marks — because at the top, even tiny mark differences create percentile jumps when you're competing against thousands of students.
Target Percentiles for Top Engineering Colleges {#target-percentiles}
Now, the question every student asks: "What percentile do I need for my dream college?"
For Computer Science Engineering (CSE)
CSE is the most competitive branch. Here's reality:
College | Typical Closing Rank | Percentile Required |
|---|---|---|
IIT Bombay CSE | 50-150 | 99.99+ |
IIT Delhi CSE | 150-250 | 99.98+ |
IIT Madras CSE | 250-450 | 99.97+ |
NIT Trichy CSE | 1,500-2,000 | 99.82-99.88 |
NIT Warangal CSE | 2,000-2,500 | 99.76-99.82 |
NIT Calicut CSE | 2,500-3,500 | 99.70-99.76 |
IIIT Hyderabad CSE | 4,000-5,000 | 99.53-99.65 |
Rule of thumb for CSE: Expect to need at least 99+ percentile minimum. For top NITs, aim for 99.5+.
For Other Core Engineering Branches
Branches like Mechanical, Electrical, Civil, and Chemical Engineering are less competitive:
College | ECE / Mechanical | Percentile Required |
|---|---|---|
IIT Bombay/Delhi | 500-1,500 | 99.82-99.92 |
IIT Madras/BHU | 1,500-3,000 | 99.70-99.82 |
Top NITs | 3,000-5,000 | 99.50-99.70 |
Good NITs | 5,000-10,000 | 99.00-99.50 |
Tier 2 NITs + IIITs | 10,000-20,000 | 98.00-99.00 |
Paper Difficulty Affects Everything
Here's a truth that surprises students: the marks required for 99+ percentile varies wildly by session.
Session Difficulty | Marks for 99 Percentile | Marks for 95 Percentile |
|---|---|---|
Very Tough | 160-180 | 90-110 |
Tough | 190-210 | 120-140 |
Medium | 220-240 | 150-170 |
Easy | 250+ | 180-200 |
This is why comparing your marks with friends from different sessions is useless. Your percentile is your only true metric.
How NTA Calculates Your Percentile
You've seen the formula, but how does NTA actually execute this calculation? Let's demystify the process.
Step 1: Receive All Candidate Answer Sheets
Every JEE Main session, NTA receives answer sheets from hundreds of thousands of candidates across multiple shifts and locations. These are digitized and stored.
Step 2: Standardize Scoring Across Sessions
NTA awards marks consistently but faces a problem: paper difficulty varies. They don't adjust raw marks yet. They first assign raw marks fairly according to the official answer key.
Step 3: Calculate Percentile for Each Candidate
For each candidate, NTA uses this process:
- Count how many candidates in your session scored ≤ your score
- Divide that count by total candidates in your session
- Multiply by 100
- Calculate to 7 decimal places
Example: If 9,985 candidates out of 10,000 scored ≤ 225 marks:
- Percentile = (9,985 ÷ 10,000) × 100 = 99.85000000 (7 decimals)
Step 4: Handle Tied Percentiles (When Multiple Students Get Exact Same Percentile)
Sometimes students end up with identical percentiles due to the discrete nature of marks. NTA has a tie-breaking protocol:
Priority | Criterion |
|---|---|
1st | Higher Mathematics Percentile |
2nd | Higher Physics Percentile |
3rd | Higher Chemistry Percentile |
4th | Lower wrong-to-right answer ratio |
This ensures no two students get the exact same rank, even with identical overall percentiles.
Step 5: Assign Final Rank
Once percentiles are finalized across all sessions, NTA aggregates candidates and assigns the final Common Rank List (CRL) based on overall percentile.
💡 Expert Tip by Prateek Gupta, eSaral: "The normalization process isn't arbitrary. NTA has been doing this for 6+ years now and has refined it to near-perfection. There's transparency in the calculation method, and CBSE verifies it independently. You can trust the system — focus on your preparation, not on conspiracy theories about session difficulty."
Tools to Predict Your Rank & College Options
After you finish your exam, waiting 2-3 weeks for results is torture. Here's how to predict your performance within hours.
How eSaral's Percentile Predictor Works
eSaral Percentile to Rank Converter uses the official JEE percentile formula combined with historical data from 45,000+ previous candidates.
The algorithm accounts for:
- Which shift you appeared in (morning/evening shift difficulty patterns)
- Historical percentile curves from similar shifts in previous years
- Normalized distribution data from NTA
- Your honest mark estimate
How to Use the Predictor Accurately
- Visit eSaral JEE Courses and navigate to the Percentile Predictor tool
- Register with your email (takes 30 seconds)
- Select the exam session you appeared in (crucial for accuracy)
- Enter your marks honestly — overestimating helps nobody
- Click "Calculate" to see your predicted percentile and rank instantly
Pro tip: If you're unsure about a question, mark it as wrong. A conservative prediction is more useful for planning than false hope.
Other Essential Prediction Tools
Tool Name | What It Does | Why You Need It |
|---|---|---|
College Predictor | Uses your rank + previous years' cutoffs to suggest colleges | Plan your choice-filling strategy before counseling |
Cutoff Checker | Shows historical closing ranks for specific colleges and branches | Know your actual chances, not wishful thinking |
Rank vs Percentile Converter | Quickly converts between your percentile and rank | Verify calculations, compare with friends |
Strategy tip: Don't look at just one year's cutoff. Check 3-4 years of historical data to understand trends. Cutoffs shift based on:
- Total number of candidates that year
- Overall exam difficulty
- Category distribution
- Seat availability changes
Team eSaral
eSaral Academic and Editorial Team
Team eSaral is the collective author profile for educational content created by eSaral’s teachers and academic contributors. The team draws on expertise from IIT graduates, doctors, experienced educators and subject specialists to develop resources for JEE, NEET and school students. Our articles aim to explain concepts clearly and help students study with confidence.
Related Posts

Plant Cell Diagram: Labelled Structure, Parts and Functions
Simple, labelled plant cell diagram with parts and functions. Covers plant cell structure for Class 6, 7, 8, 9, 10 and 11 students, CBSE-aligned.

Saransh Gupta Sir's Visit to IIT Patna: Hostel Life, Placements & Lessons for JEE Aspirants
Inside Saransh Gupta Sir's IIT Patna visit — hostel life, the library, placements, internships, and real advice for JEE aspirants from students living the IIT dream.
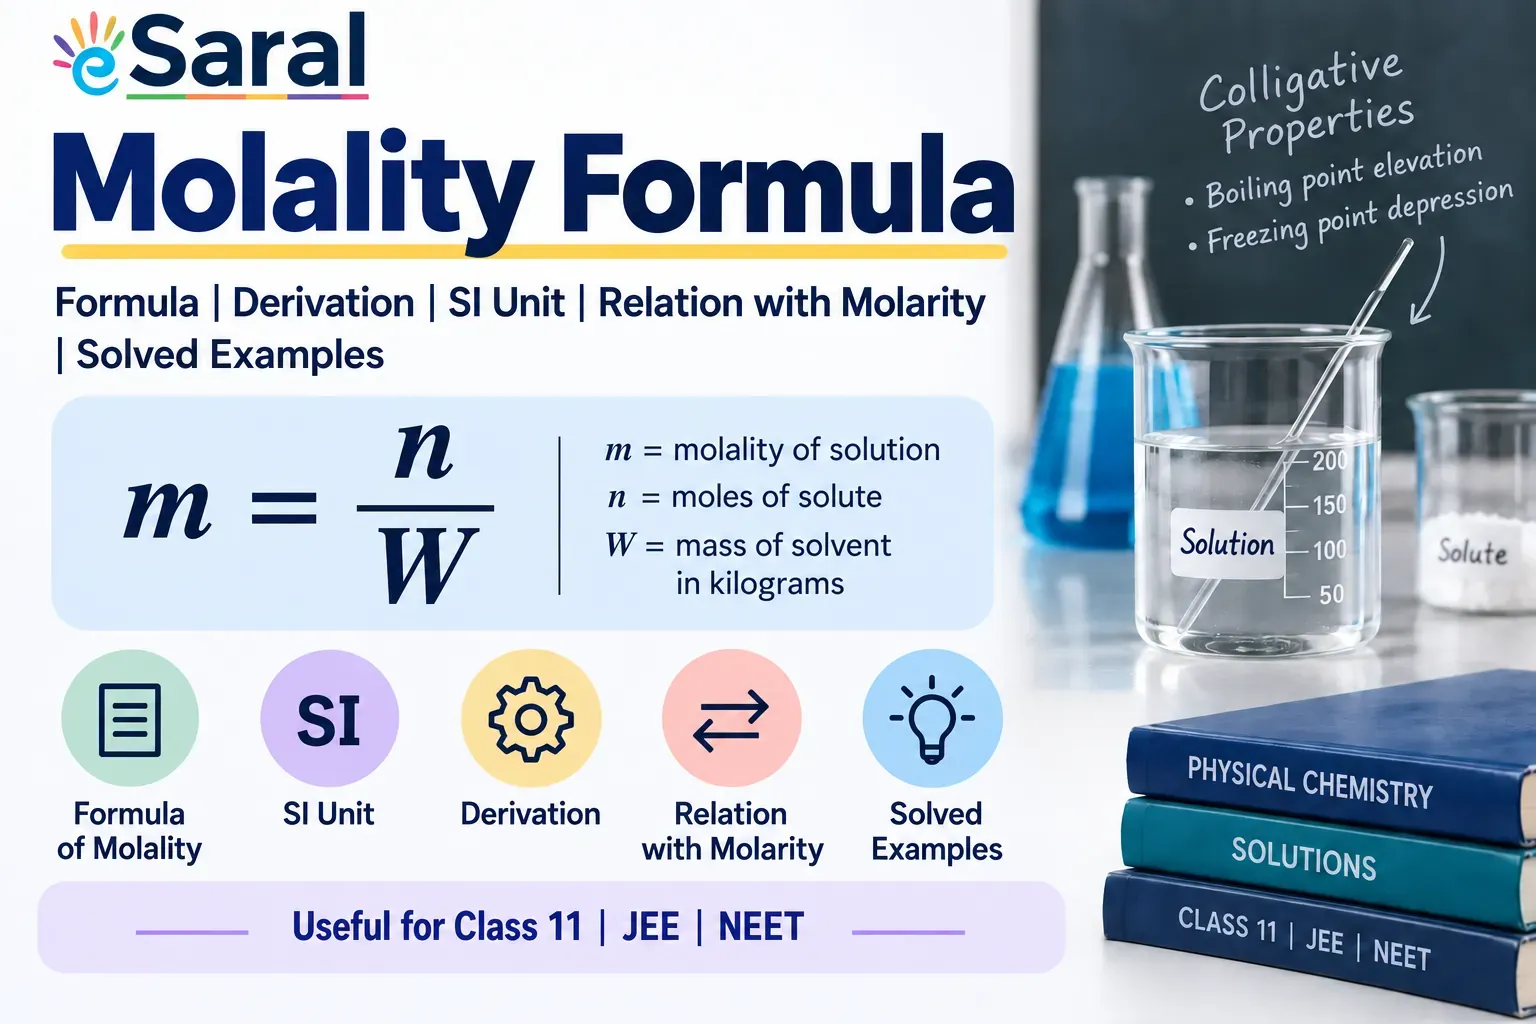
Molality Formula: Formula for Molality, Derivation & Solved Examples
Molality formula is $m = \dfrac{n}{W}$. Learn the formula of molality, its SI unit, derivation, relation with molarity, and solved examples for Class 11, JEE and NEET.

BITSAT Previous Year Question Paper PDF
Download BITSAT previous year question papers PDF. Get year-wise BITSAT PYQs, memory-based papers, exam pattern, and preparation tips to improve your BITSAT preparation.

Teachers’ Day 2026 at eSaral Gurukul: Celebrating the Bond Between Students, Teachers & Mentors
See how Teachers’ Day 2026 was celebrated at eSaral Gurukul, reflecting the bond among students, teachers, and mentors, and the role of guidance beyond academics.

JEE Advanced Attempts: Can You Give It a Third Time? Rules Explained
JEE Advanced attempts: current rule is 2 consecutive years only: full eligibility criteria, the 2025 third-attempt controversy, and the latest 2026 petition news.

Best JEE Preparation App
Best JEE preparation app for Main & Advanced: AI mock tests, live doubt-solving, thousands of practice questions. JEE preparation app for droppers & Class 11-12.
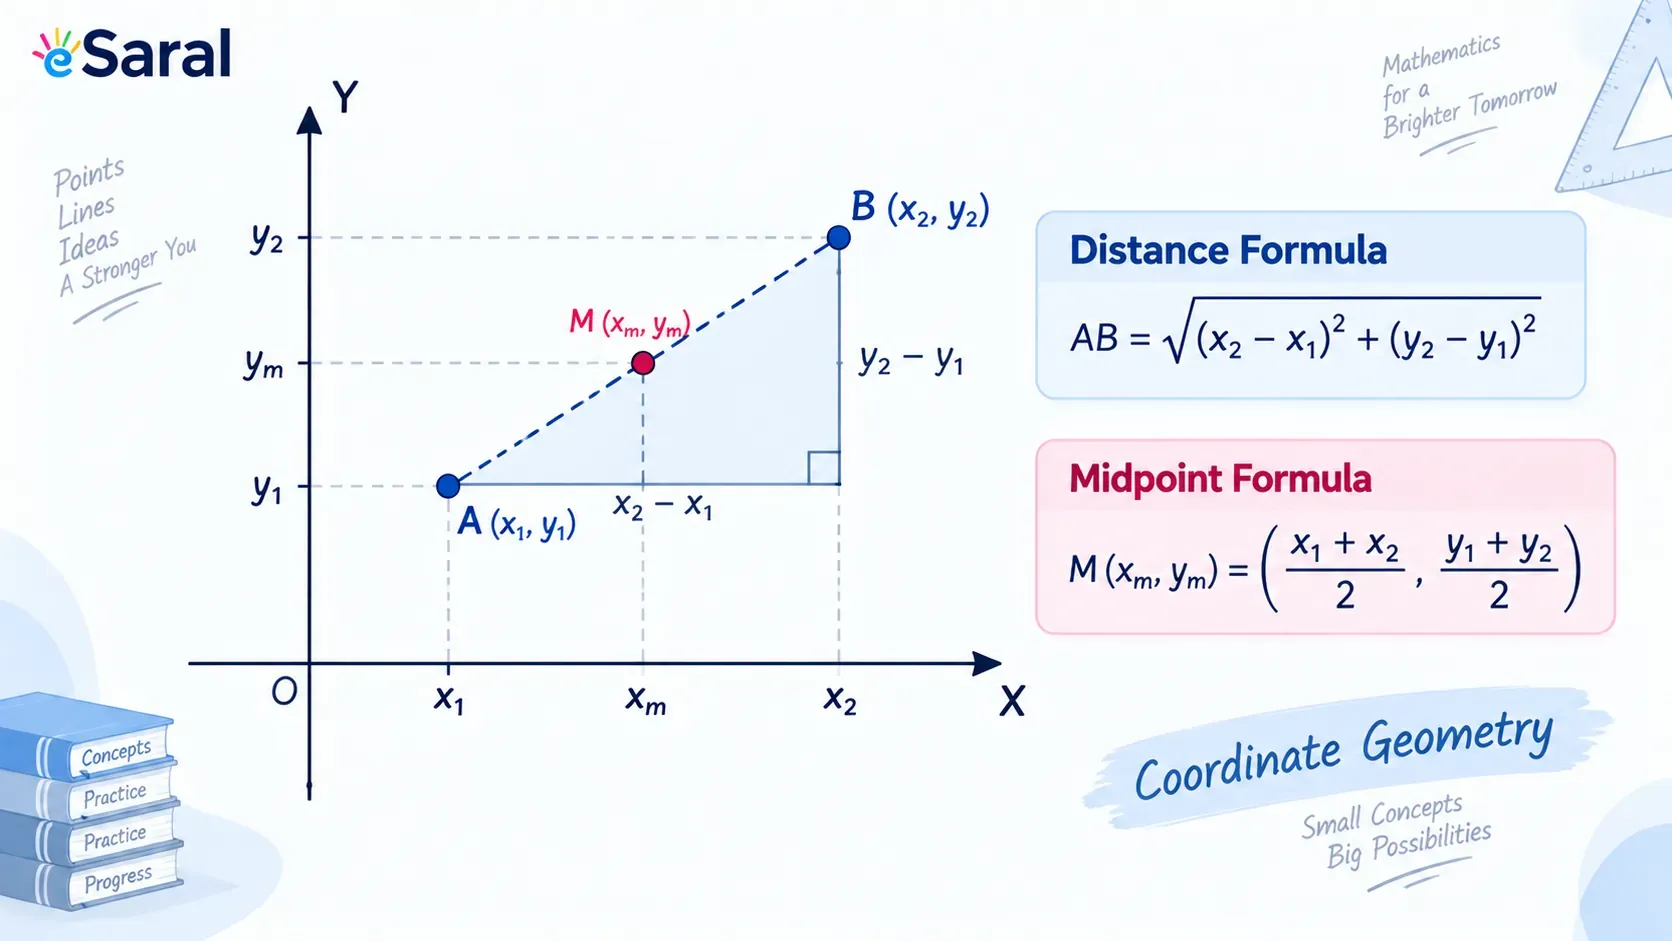
Coordinate Geometry Class 10: Formulas, Notes & Solved Examples
Coordinate geometry class 10: complete CBSE formulas — distance, section, midpoint and area of triangle — with derivation, notes and solved examples.

How to make Notes For JEE Smart Notes Strategy of an AIR 41
Learn how to make notes for JEE the way toppers do — indexing, shorthand, and smart short notes for JEE that cut revision time to just 5–7 days.

SL Arora Physics Class 12 Index – Chapter List for Volume 1 & 2
SL Arora Physics Class 12 index — complete chapter list for Volume 1 & 2, mapped to NCERT solutions for board, JEE Main, and NEET preparation.